Another week, another update.
The presentation is actually coming together- though I have to admit, I’ve very much realized that I’m out of practice when it comes to doing conference presentations, or the power points to go along with them.
Thankfully, my friends are generous and I can bounce stupid questions off of them for things that I’ve forgotten, like. what’s a reasonable amount of data for 20 minutes? And also.. whats interesting to people that aren’t me?
Now that I’ve got the transcription uploaded into a database, and the data fixed (there were some transcription howlers, of course- dates where 1959 became 1059, for example). I’ve luckily fixed all of those. There may be others I’ve not found yet, and well that’s reality. All in good faith and fixing things. But I’ve also started to figure out-once again- how to pull data from a database in interesting ways.
Which inevitably ends up with me putting the output back into a spreadsheet, and then creating a chart. I could- probably should- use R, but to be honest my limited skills there have attenuated- and there aren’t the kinds of connections between records that R is really good at visualizing.
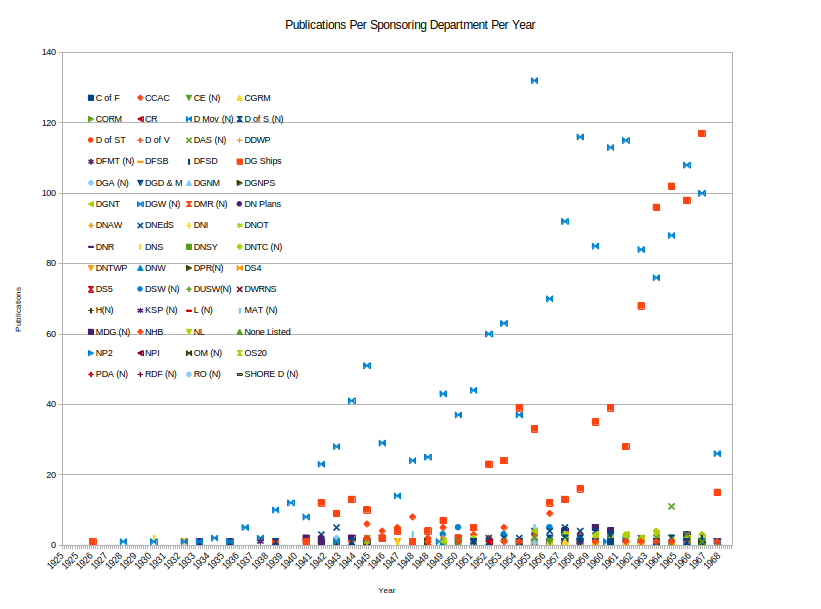
I’m really quite proud of this chart. First of all, let’s start with the one admission- that LibreOffice Calc has this annoying habit of making years 350 days instead of one year… which is really annoying when you’re only using YY as your date format, with no days or anything. it’s just really annoying. And I can’t figure out how to make that work properly or otherwise I would.
What this chart shows is the count of publications per year for the publication/edition date, by sponsoring department across the entirety of BR1 1968. We have no way at getting at how many editions there are of these texts- but it certainly shows a ramping up of updating texts, or adding new texts- unfortunately these are indistinguishable. Since I’ve been the one inputting all the bloody lines, it’s really no surprise that DG Ships and DGW(N) – Ships and Weapons systems departments- are the two most prolific sponsoring departments. But it’s interesting to see how my suppositions are bearing out in the numbers. This chart does not include the several hundred line items that have title and sponsoring department but no date. I have a few other charts. I should point out that this is Line Items- not individual books/numbers, which I think is important to point out.
With about a month to go until the conference I think I’m in good shape. I’ll definitely be writing from notes- otherwise I’ll never get these numbers (of how many line items per different category that I’ve been looking up). I think part of the problem is that I really do wish I had the 1951 edition already transcribed, so I could be doing comparisons. But I knew I wouldn’t get that done this summer.
Hopefully next blog post I’ll be able to talk about something else.


