 Darren S. Layne received his PhD from the University of St Andrews and is creator and curator of the Jacobite Database of 1745, a wide-ranging prosopographical study of people concerned in the last rising. His historical interests are focused on the mutable nature of popular Jacobitism and how the movement was expressed through its plebeian adherents. He is a passionate advocate of the digital humanities and of creating organizational methods for historical data and metadata. Also, thank you to Darren for transcribing some of the reports that are part of the ADM 8 Database Project, it is *very* much appreciated.
Shortly after responding to Dr McLean’s distress flare seeking further recruits to help transcribe his ADM 8 project, I was tasked with devising a database-friendly schema for a particularly awkward bundle of the source documents. Of the 243 reports within the Admiralty List Books of ADM 8/1 held at the British National Archives in Kew, seven of them belong to a category called Additions & Lessenings Lists (A&L). These reports track the status of Charles II and James II/VII Stuart’s royal ships in service between 1674 and 1689 using a simple columnar system akin to that which might be found in a financial ledger. For those who have experience with transcribing hand-written documents from any era, you will know that certain creative liberties sometimes must be taken in order to represent the data in a manner that is useful for machine-readable searches. Case in point, these A&L reports present a lively challenge of redefining columnar, state-based data for entry into a field-based relational database. The following solution essentially renders this square-peg historical information round-hole compatible.
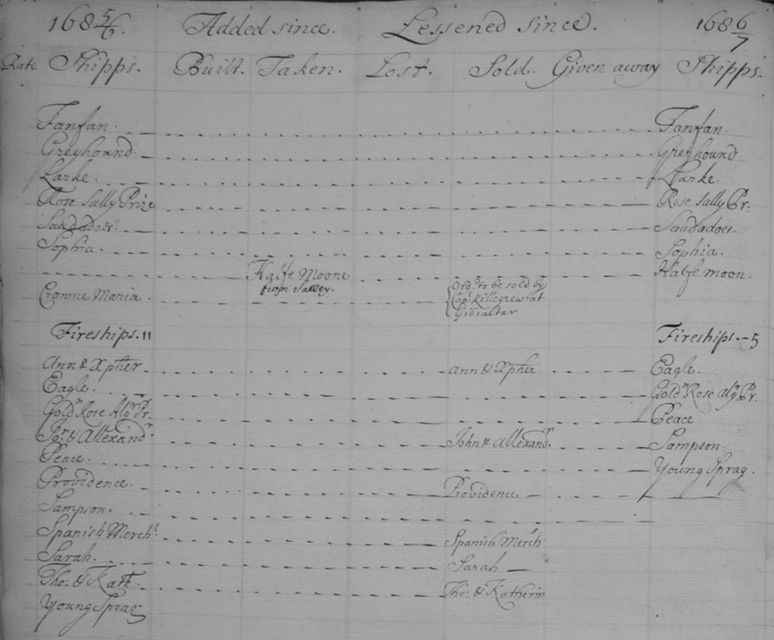
After reviewing images of the documents and having a brief meeting with Dr McLean to discuss the parameters and goals of the larger project, I spent some time thinking about how to visually represent the transcribed data. It would be crucial to streamline the process as much as possible to avoid data redundancy, all the while making sure it would fit in with the structure and back-end uploading process that had already been devised. So what are we looking at? As depicted above, each A&L report features a number of ships which were present at a particular time (incoming, or ‘A’) and tracks whether they are still present at another, later time (outgoing, or ‘Z’). Between the two statuses are numerous columns that show whether and how any A-ships were lessened since the starting date of the report, as well as whether and how any Z-ships were added since that same time. It follows, then, that the names of A-ships which were lessened would not appear in the ending column, and the names of Z-ships that were added would not appear in the starting column. Both additions and lessenings are then broken up into statuses that tell us how they were handled by the navy. Additions include ‘built’ and ‘taken’, while lessenings feature ‘lost’, ‘sold’, or ‘given away’. To further complicate things, some ships changed their ratings – from 4th-rate to hulk, for instance – while others simply changed names. All of these things are visually tracked in the A&L reports using basic text. But how could this information be dropped into a searchable database while keeping the utility of the reports intact?
Straight transcription was not going to do the job, so I considered other tools to help create a useful format that would preserve the structure of the data. From my experience with using Airtable on my own database project, I was convinced that it could handle this task. If your historical scholarship requires that you are creating Excel documents of any size for database-creation or otherwise, I cannot recommend Airtable enough. In essence, it blends the functionality of a spreadsheet and a database with a gorgeous, clean UI that is hugely adaptable and automatically syncs across devices that run on all operating systems. It can handle the import and export of CSV files, has team-based features for collaboration, and tracks changes per user. Customized forms can be created to allow the entry of large amounts of data, and those forms can be sent out for remote entry or integrated into other collaborative productivity suites. Both tables and sheets in Airtable are directly embeddable into WordPress and HTML, which allows others to play around with your results without being able to alter the data or its structure. And all of this is just the tip of the iceberg. So Airtable was the right tool, but now I had to consider a useful taxonomy to use within it.
When thinking about data structure, perhaps the most important thing on which to focus is how to capture everything the source has to offer. As with categorizing the fields on a traditional spreadsheet or database, we can look at the A&L reports and see a number of definable characteristics: ship name, ship rate, added or lessened status, added or lessened category, and any further notations relevant to a particular vessel. For purposes of conforming to the larger database structure, it was also important to add in fields for archival source references and any people, locations, or dates mentioned in the reports – all of which are relevant to specific ships. Finally, because I firmly believe that transcribed data should remain as ‘pure’ as possible, a second field for the standardized names of ships was created. This would allow us to create an ‘authority’ field for each ship’s name, regardless of how it was spelled in the manuscript itself, while including both in the database.1
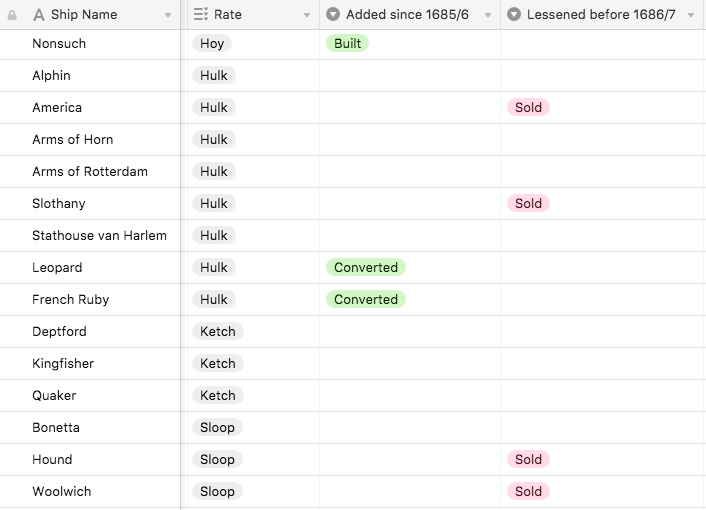
Entering linear categorical text is simple enough, but the complex part of this project was defined by two issues: one, how to represent the changing statuses of ships through each discrete report, and two, how to indicate that some vessels were not yet present at the opening date and that some were no longer present at the closing date. These issues were solved by using Airtable’s customizable field types and a bit of logical organization. Each vessel within each discrete A&L report was first given a unique entry along with its standard identifying characteristics in corresponding fields: ship name (both standardized and as written), rate, and archival reference. Two single-select fields were then created to represent addition or lessening status, and specific selection titles were created to include all possibilities from the reports.2 These two fields could really be given any titles, but my proof-of-concept simply marked them as ‘Added since X’ and ‘Lessened before X’, which corresponded to the starting and ending dates of each report. Both fields were then populated with any statuses that were present in the reports.
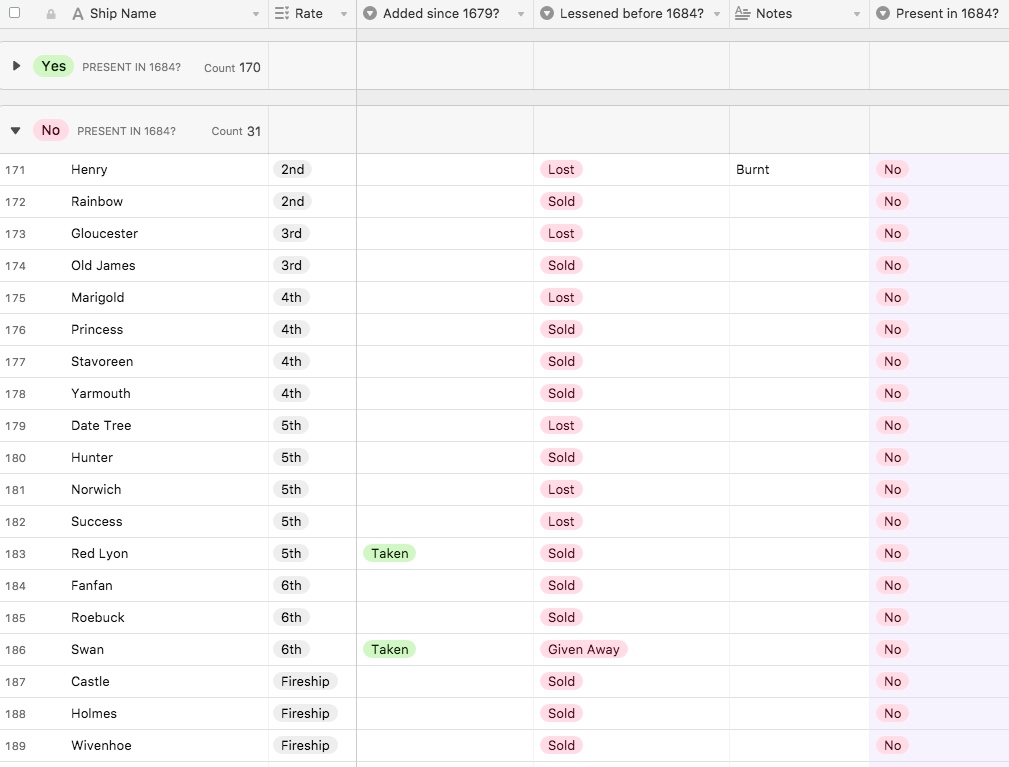
Because the A&L statuses were entered as single selections, they can be manipulated easily for searching, filtering, and customized views. To further ease this process, a simple ‘yes/no’ single-select field was also created to mark each vessel as present or not present at the culmination of the report. In effect, this serves as a verification of a given ship’s ‘final’ state as indicated in the report and it cleanly matches up with the color-coded addition or lessening statuses for the express purpose of sorting by presence per year.
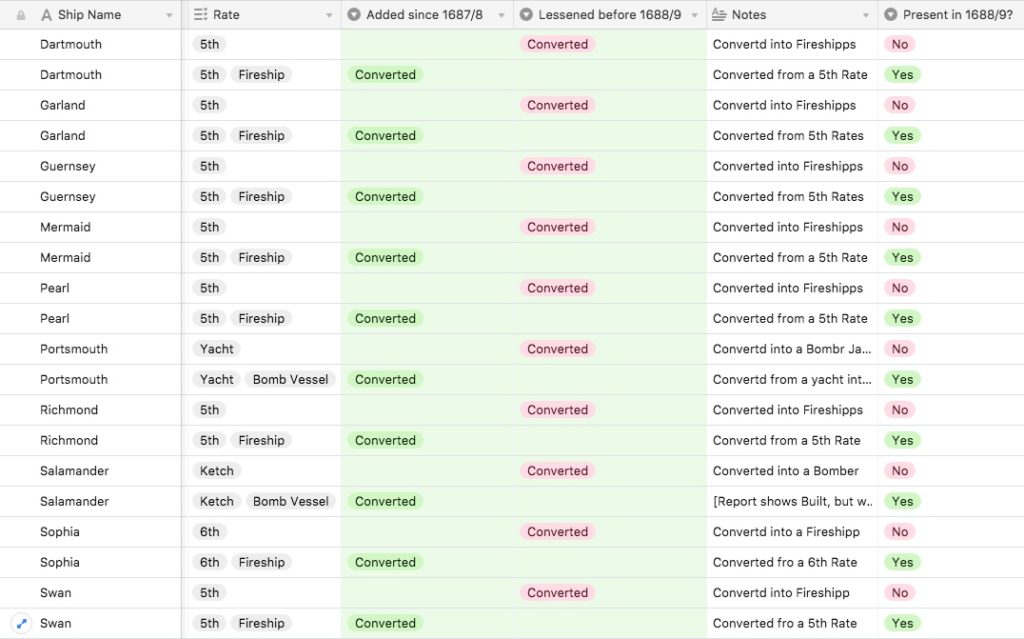
Each vessel’s rating was given a multiple-select option, which offers the same grouping and filtering benefits as single-selections but with the ability to list more than one rating in a single field. While no ship was physically registered simultaneously as having more than one rate, a vessel does not in actuality cease being 2nd-rate because it is repurposed as a hulk for the carriage of prisoners, and a sloop is still a sloop after it is turned into a fireship.3 Ships that were converted from one rate to another therefore needed to be represented in a manner that is consistent and that allows recognition of their rates or types before and after conversion. This presented a bit of extra complexity, but to cover it, a simple system of tracking was created right within the tables. By way of example, ADM 8/1 (ff. 242-245) contains 175 unique vessels, but you can see when looking at the corresponding spreadsheet that this particular report actually contains a total of 185 records. This is because ten of the vessels were conversions, and each vessel has a unique entry for both its ‘before’ and ‘after’ status. When filtered and grouped by ‘converted’ status, all ships with that status appear twice: once with its pre-conversion rate or type (not present at the ending date of the report) and once with both its pre- and post-conversion rate or type (all of which are present at the ending date of the report). This tweak allows us to track the changes to a specific ship or see all of them at once using Airtable’s customized views.
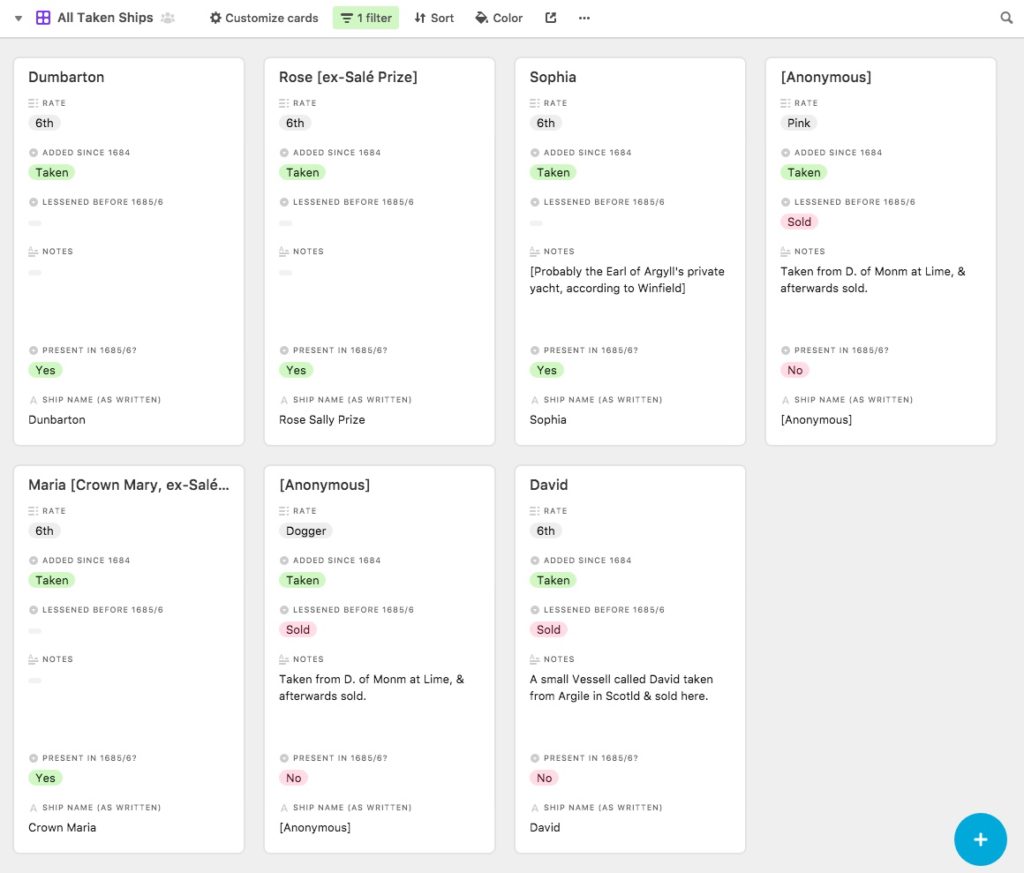
The ability to create views offers tremendous utility and flexibility for drawing data out of our transcribed reports for analysis. In just a few quick moments, we are able to create and save divisions of information relevant to any characteristic or status that the original reports featured. For instance, ff. 201-203 (May 1684 to January 1685/6) contains a number of ships that were added since the 1684 beginning date, all with the status of ‘taken’. Viewing those records in gallery mode allows quick reference of additional information about those vessels (five were 6th-rate and three were subsequently sold off before Jan 1685/6), as well as allowing the rearranging of individual cards as needed. Other views include kanban (which stack on a single variable for easy visualization), calendar, and form.
Furthermore, each report’s corresponding table is exportable as a CSV, which means that Dr McLean now has a consistent and compatible template with which to upload this information into his database. Even without being added into the larger scheme, however, the A&L reports as transcribed into Airtable provide a very flexible and accessible presentation of the raw data from the original manuscripts, now effectively reinterpreted into a machine-readable format. Indeed, I am already starting to think about how to build an inclusive ‘master base’ that compiles all vessels listed within the disparate A&L reports into one single timeline. This would essentially provide a kind of ‘service record’ to allow tracking of each individual ship and how it was used by the British navy through the years. But that is, of course, only one use case for this information. By mixing in further external Admiralty report data and some creative table construction, there are plenty of future options and applications for analyzing data from the National Archive’s Admiralty List Books. This has been but one small but quite enjoyable study.
If you would like to have a look at our entire Airtable base for the ADM 8/1 Additions and Lessenings Lists, you may feel free to do so here. Make sure to look at the reports using different views, which can be found in the upper-left-hand corner of the menu bar, just underneath the table tabs. Note that some of the saved views vary per specific report.
- Each ship in the ADM 8/2 A&L reports was cross-referenced with secondary sources to corroborate their presence and statuses. These sources included Rif Winfield’s British Warships in the Age of Sail, 1603-1714: Design, Construction, Careers and Fates (Barnsley, 2009) and J.R. Tanner (ed.), A Descriptive Catalogue of The Naval Manuscripts in the Pepysian Library at Magdalene College [vol. I] (Cambridge, 1903). For more on data purity, see ‘Appendix I: Notes on Technical Methodology’ for The Jacobite Database of 1745 in D.S. Layne, ‘Spines of the Thistle: The Popular Constituency of the Jacobite Rising in 1745-6’ (unpublished PhD thesis, University of St Andrews, 2016), pp. 233-235.
- These selection titles were also color-coded in green and red to aid with quick identification.
- In this context, ships’ ratings were based on the number of decks and guns they were built to carry, not how many guns were actually present on board at a given time. Likewise, unrated ships like sloops, ketches, and yachts are usually named by the number and configuration of their masts and/or rigging. See Winfield, British Warships, pp. 212-259 and the Unrated Naval Vessels page on Royal Museums Greenwich’s website.
