
Ropewalks — the long, narrow buildings and spaces where rope was manufactured for maritime use — were once found in every port town. Every sailing ship that crossed an ocean before the twentieth century carried miles of rope, and every length of that rope was made in a ropewalk. Today most ropewalks are lost, now only recognized in the street names where they once stood.
This blog post describes the building of a digital platform for the research project Age of Rope, led by Professor Christy Anderson (University of Toronto), a study of the architecture, agriculture, and labour of ropemaking. We discuss the choice of an online mapping platform, the presentation of primary research in a public-facing and open-access format, the collaboration between faculty and student research assistants, and future plans for the larger and ongoing project.
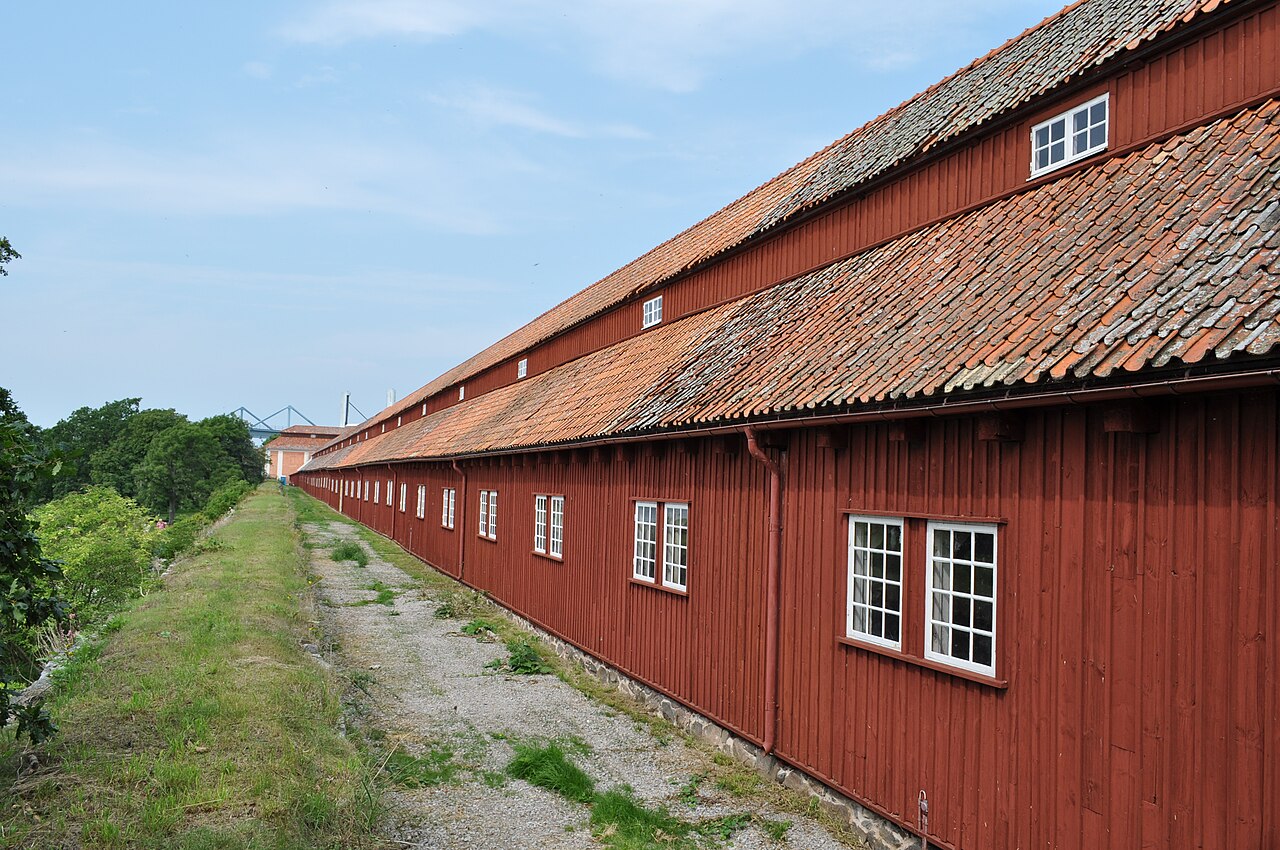
Ropewalk building in Karlskrona, Sweden, built in 1692. At roughly 300 metres long, it is still Sweden’s longest wooden building and part of the UNESCO World Heritage Site of the Naval Port of Karlskrona.
The history of rope must be pieced together from scattered sources: buildings that have mostly vanished, agricultural landscapes that have been transformed, and production knowledge that was rarely written down. A project with this many moving parts — industrial heritage, agricultural and environmental history, maritime history, the history of techniques, architectural history — is best suited for a team of researchers. Each strand opens a different point of entry for students, and each topic gives them a chance to develop research and public humanities skills they can carry into their own work.
Nica Fleming, an undergraduate student at the University of Toronto, began work for Christy Anderson in the summer of 2025, compiling a database of ropewalks by gathering images, bibliography, and location data for each. Nica started by researching extant and well-known naval ropewalks such as those at Chatham, Rochefort, Boston, and Venice. The challenge, however, was to reconstruct what could be known about lost or smaller scale industrial spaces.
There is no single history of the ropewalk as a building type and therefore the research required initiative and creativity. Nica used a variety of dispersed primary and secondary sources, including heritage site registries, fire insurance plans, and municipal history societies to find information on lesser known sites. That information was collected in a database with categories on location, dates, materials, structural type, length, and so on. Then, Nica mapped the ropewalks found so far using ArcGIS.
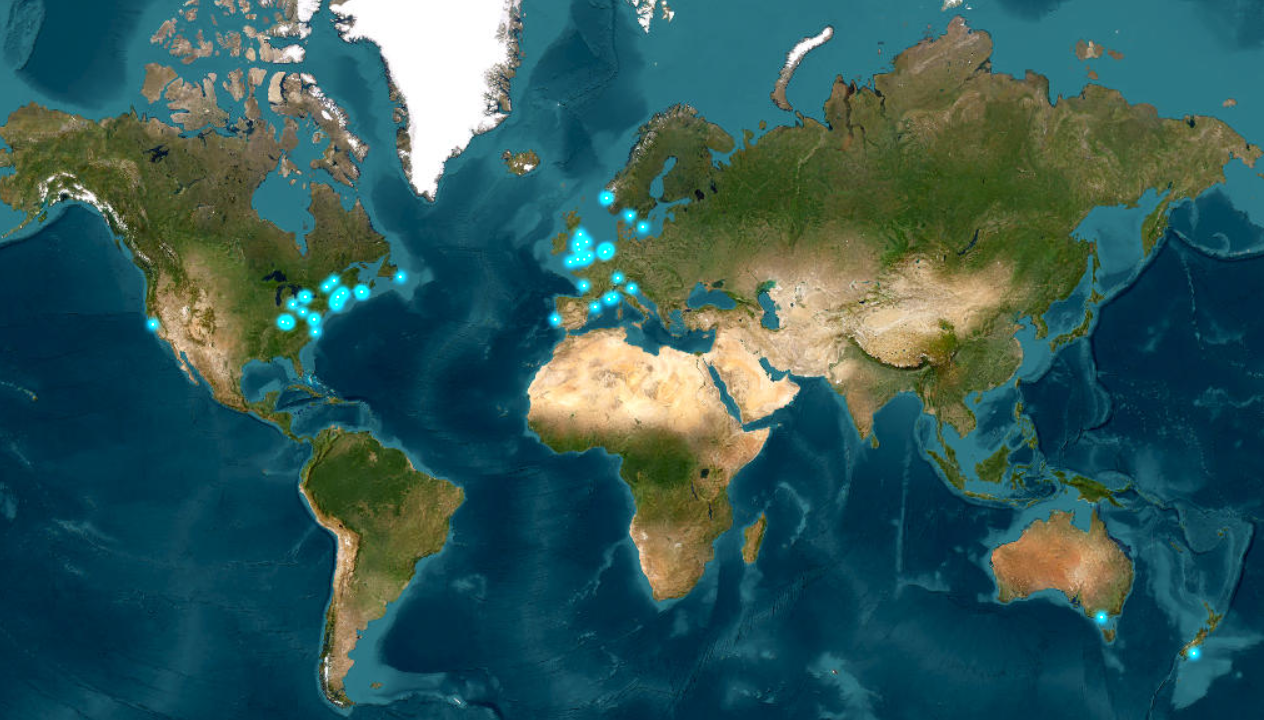
The blue dots represent the location of ropewalks
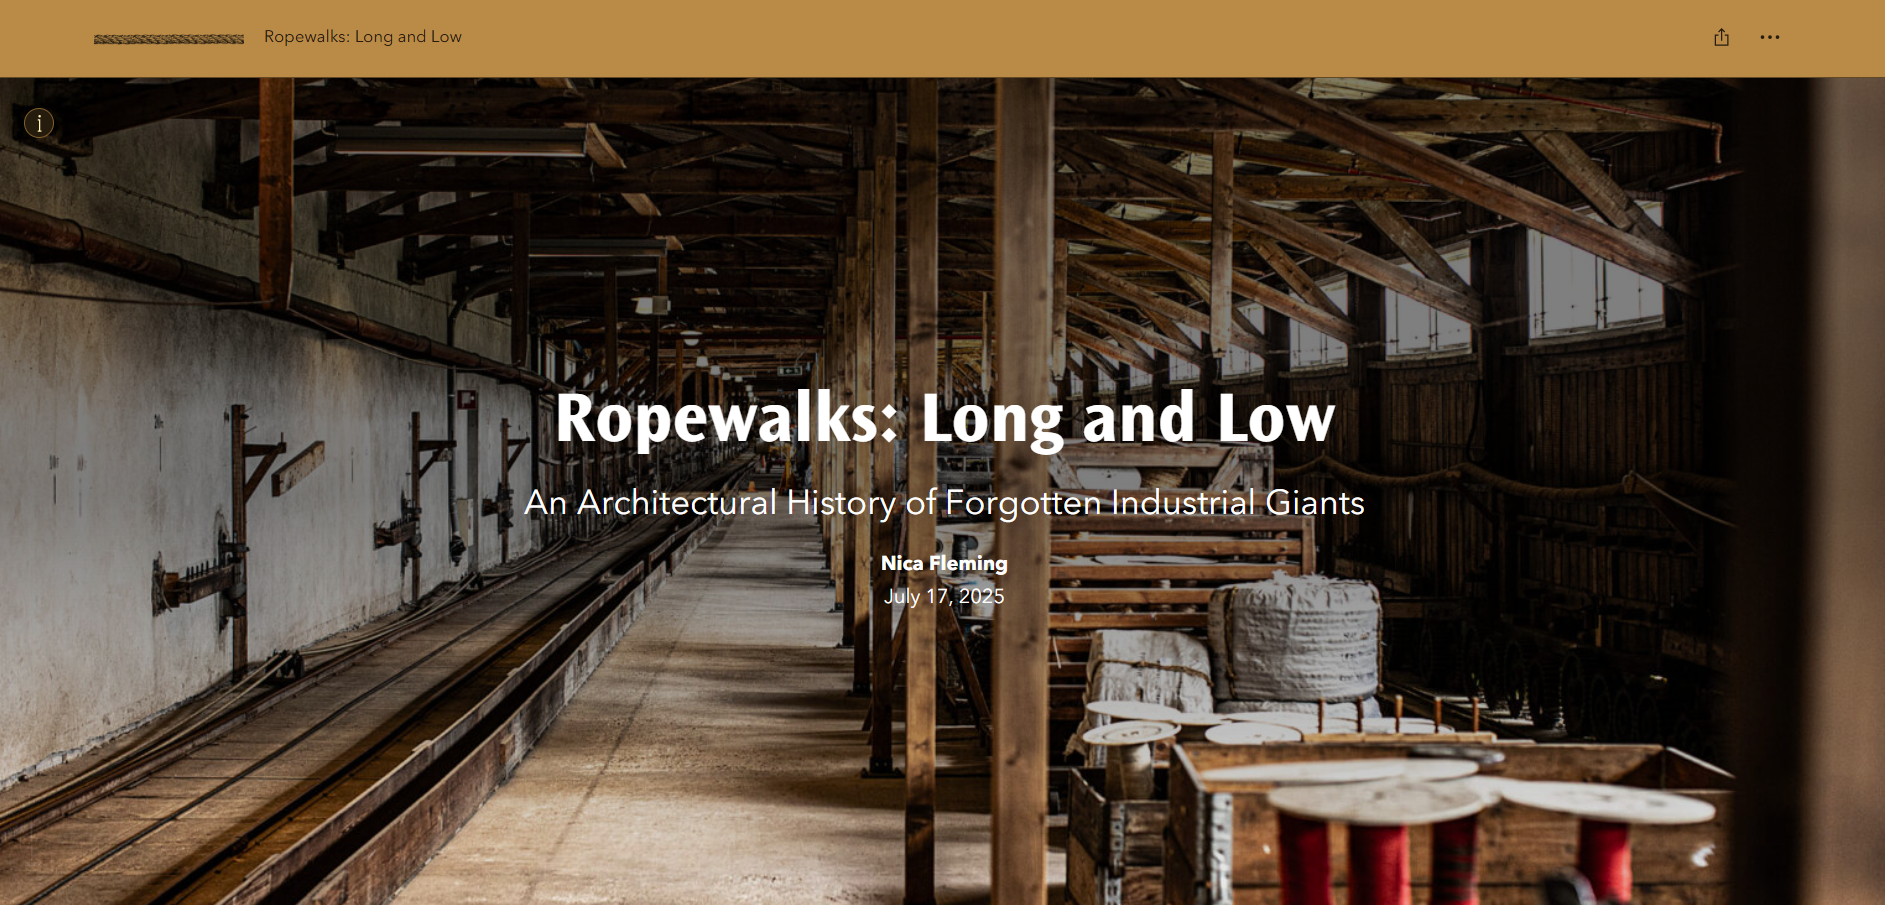
In order to present a story about the importance of ropemaking spaces, we uploaded our maps onto an online platform called ArcGIS StoryMaps. StoryMaps is a readily-available website-builder for creating multi-media narratives based on maps, combining geographical locations with text, pictures, videos, and more.
Why did we decide to map these buildings? The argument we wanted to make was geographical before it was architectural: that rope production was not a specialist or marginal industry but one woven into the fabric of every maritime economy, present in every port town and many places beyond the coast. A list of sites, or even a set of case-study essays, could not make that argument as directly as a map. When a reader sees a multitude of points distributed across the Atlantic and Mediterranean (the focus of this first phase of research) the density and spread of the industry becomes immediately visible. The map is not an illustration of the argument; it is the argument.
The form also suits the material. Ropewalks are a distributed archive, scattered across coastlines and inland fields from the Mediterranean to North America, and no single museum or monograph holds them in one place. A map can, and our map is the first one to bring these dispersed structures together.
A map of many points is a starting argument, not a complete one. Knowing where ropewalks were tells you something, but it does not tell you what they looked like, who built them, who worked in them, or what happened to them. We needed a way to move between the scale of the whole and the scale of the particular — a single building, a specific labour system, a documented fire or demolition. ArcGIS StoryMaps lets us combine the map with text, images, and archival sources in one platform, offering a narrative path through our data. The StoryMap also gives us an honest way to represent what we do not yet know: the map has gaps, and the gaps are visible, which is itself a form of argument about where research still needs to go.
Two principles guided the design of the StoryMap, both drawn from Telling Stories with Maps, (Esri, 2025): repetition and atmosphere.
Nica writes: I wanted readers to understand the organization without having to think about it, so I used repetition to create a legible structure. Each section (broken into topics: ropemaking, naval ropewalks, ‘cottage’ ropewalks, forms of labour, urban legacies, and present states) uses the same elements — a full-screen map of our data points, a zoom into one case-study ropewalk discussed in relation to the section’s theme, and any subtopics that follow as stand-alone images and text. The rhythm helps viewers know where they are, and lets them focus on the information rather than the structure. I also worked on the visuals: a custom theme that evokes the inside of a “long and low” ropewalk — wooden, dark, dusty — with a light-blue accent and rope icons tying the look to the project’s naval context.
As a public humanities project, the Ropewalks: Long and Low StoryMap is written for a mixed audience — architectural and maritime historians, heritage professionals and eco-museums, and readers with no prior knowledge of ropewalks. The platform is open access, readers can use it on a computer or a phone, and the StoryMap links outward to our project website, our Instagram, and the heritage organizations that steward individual sites.
Labour is one of the histories the StoryMap can carry that a single building study cannot. The same product was made by guild artisans in Venice, by women and children in Dorset cottages, by enslaved workers in colonial ports, and by state-controlled naval workforces at Rochefort and Karlskrona. Putting all of those sites on one map makes the comparison unavoidable, and the case studies let us tell each story in the terms that suit it.
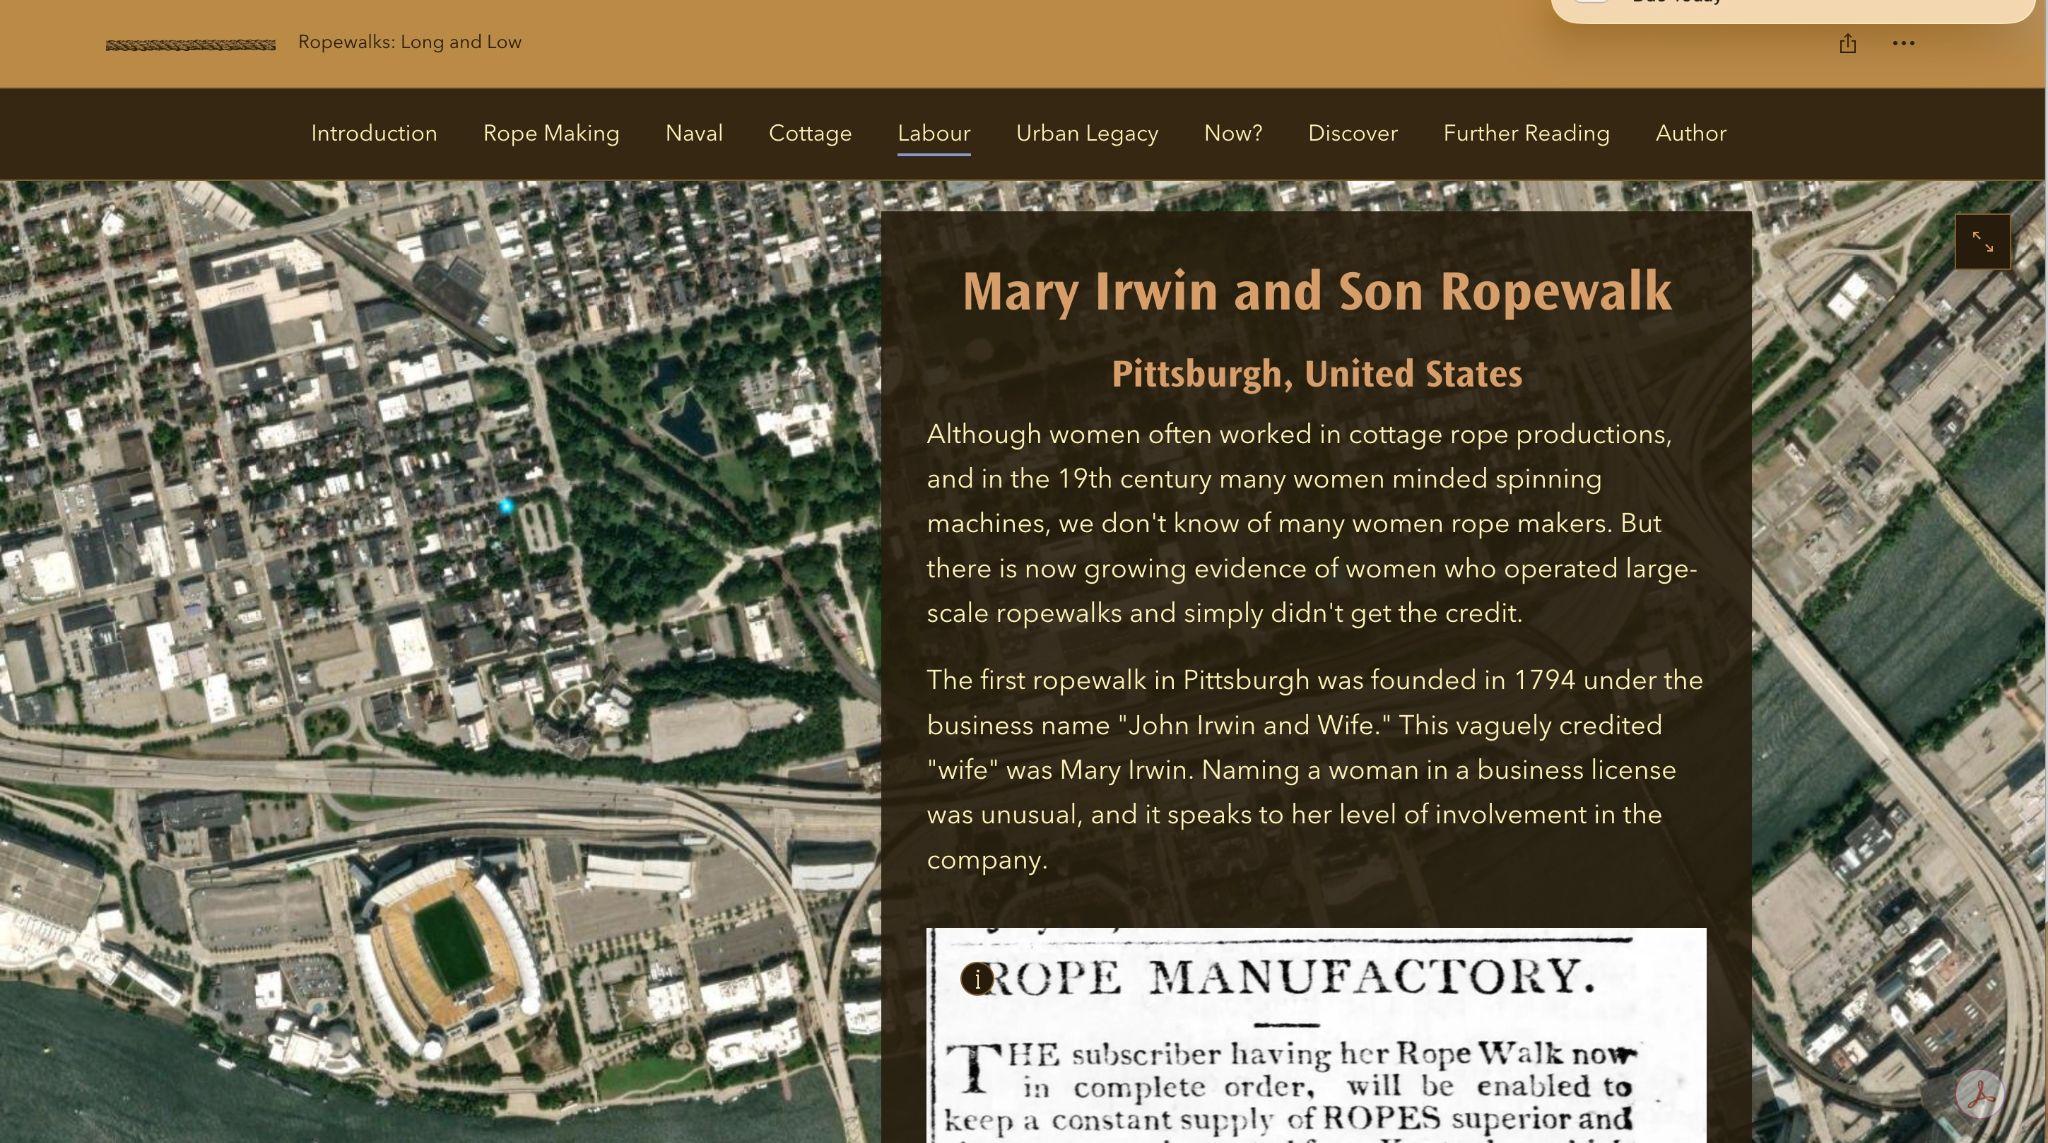
Screemshot from the StoryMap
For example, one ropewalk on our map sits in Pittsburgh, Pennsylvania. The building is gone, but its name survives in a street called “Rope Way,” and its founder, John Irwin, has an elaborate gravestone commemorating his life as an honoured citizen of Pittsburgh. A database or a map could show that rope was once made here, but our StoryMap is able to go much further. New evidence shows that the Pittsburgh ropewalk, first called “John Irwin and Wife,” was operated by Mary Irwin. Women were not supposed to run businesses in 1794, when the ropewalk was founded, which is likely why John’s name was on the business license. But Mary quietly managed the ropewalk for two decades, successfully creating one of the first industrial ventures in Pittsburgh, before eventually passing it on to her sons. Today, her name has been eclipsed by her husband and son’s (both John Irwin), and her grave marker is no bigger than a footprint.
By combining points on a map, visual sources, and textual analyses, our StoryMap creates a narrative that explains many facets of the history of rope making. A standalone map, database, or series of essays would not be able to tell this story.
Many of the ropewalks we want to study are gone. As ropemaking moved to mechanized factories and synthetic fibres in the nineteenth and twentieth centuries, most ropewalks were torn down. The word itself has slipped along with the buildings — “ropewalk” has no direct equivalent in most other European languages, one reason these structures rarely surface in comparative studies.
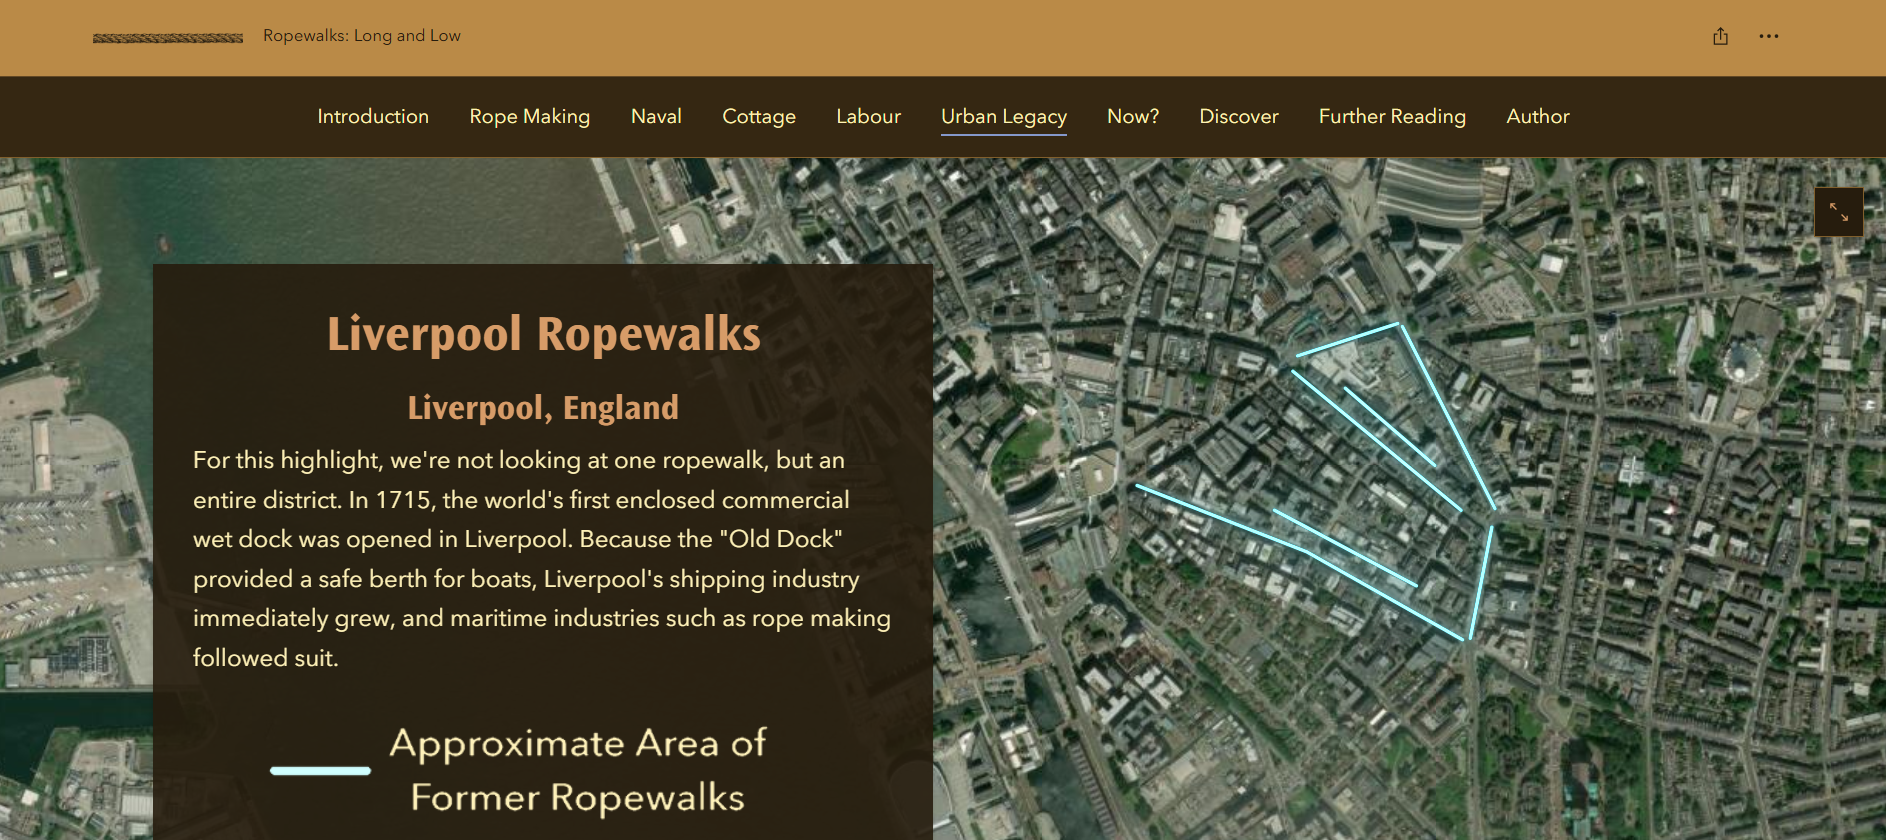 Nica writes: The last piece of mapping involved ropewalks that no longer survive. This is one of the StoryMap’s real advantages: it lets us recreate buildings that are no longer visible. I drew the potential footprints of these ropewalks on the satellite maps so readers can see where to look. This was an important addition, because many of the lost ropewalks give the clearest examples of exploitative labour — sites worked by enslaved people, or by children in cottage industries. We needed to tell those less visible parts of the story too.
The StoryMap is publicly available, but it is not finished. Adding to it is part of the project’s ongoing work. Nica continues to enter ropewalks into the database, especially sites outside Europe and North America, and the StoryMap grows with it.
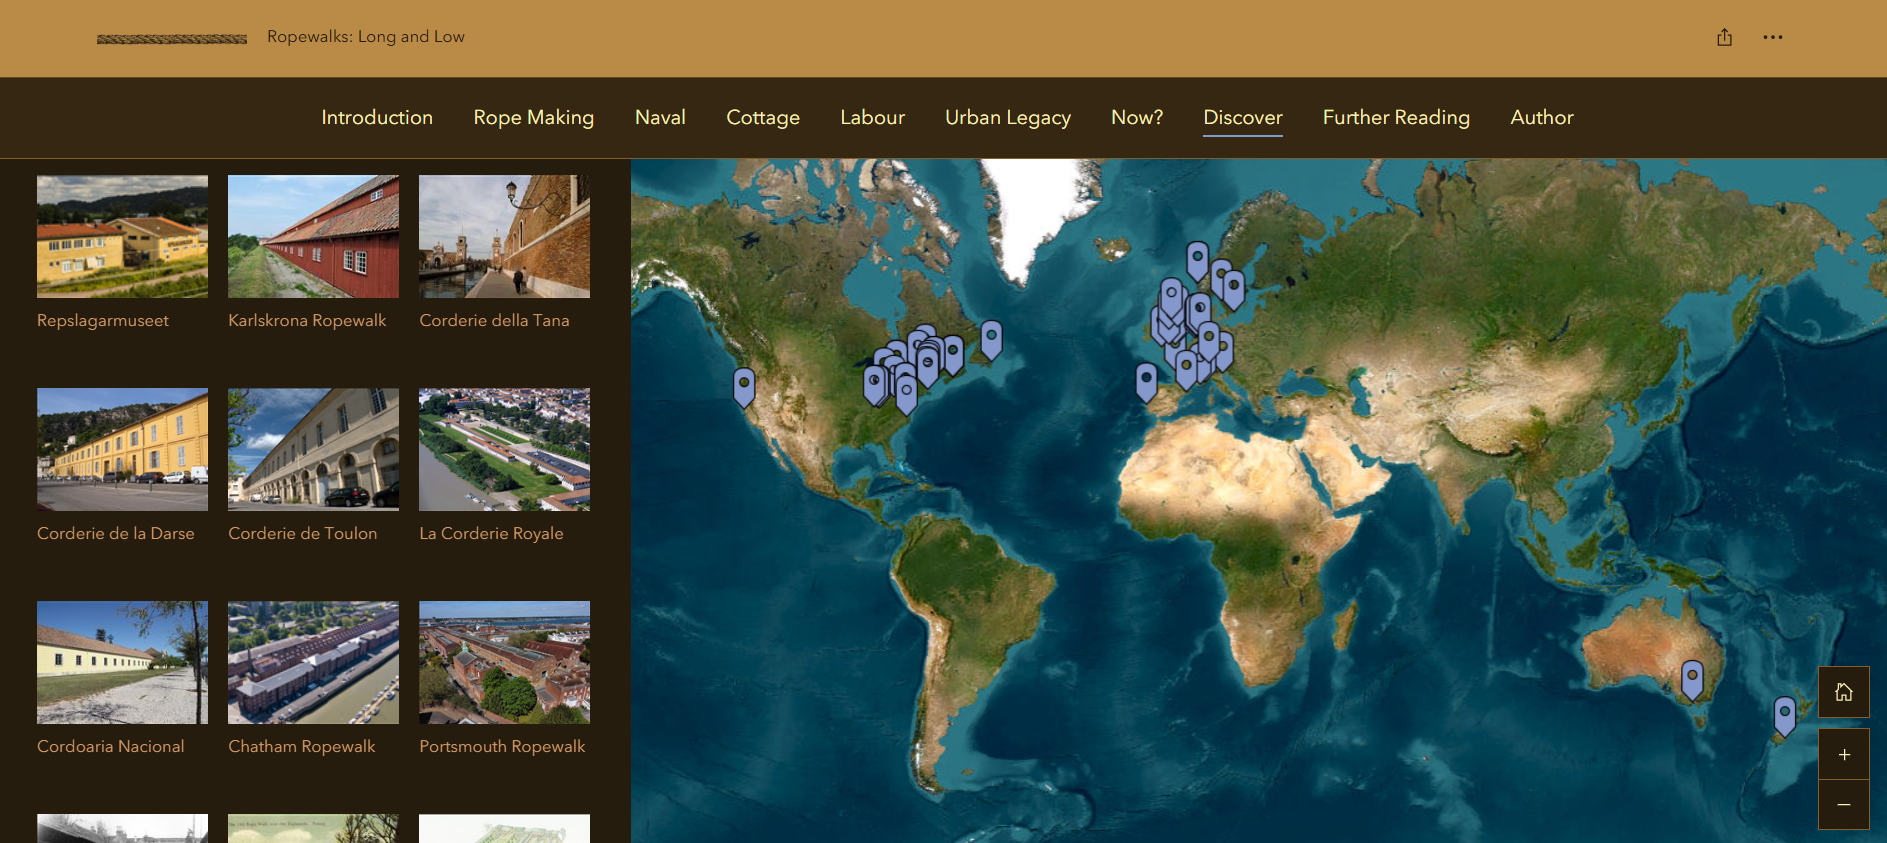
The ‘Discover’ Section
The StoryMap is one part of a larger digital ecosystem. The database behind it feeds our Instagram account, @age_of_rope, where Nica posts a weekly “Ropewalk of the Week.” A project website now in development will host scholarly articles, the full gazetteer, and links outward to the heritage organizations that steward individual sites. Each piece points to the others.
For a building type so easy to overlook, the StoryMap makes a simple but consequential claim that rope production was integral to every maritime economy, not marginal to it. The work of filling in the gaps — and of telling the human stories those buildings held — is what Age of Rope seeks to do.


