

Amy Walker
Amy Walker is a historian specialising in histories of poverty, ‘ordinary people’, and heritage. She completed an Undergraduate degree at the University of Greenwich and a Masters degree at the Institute of Historical Research. She is currently working on developing her project on the history of streets demolished by the London County Council during the 1930s. As part of her MA, she created a trail on Layers of London, showing different events of her Great Grandfathers life, https://www.layersoflondon.org/map/trails/south-east-london-from-an-ordinary-person-s-perspective-1895-1952. The topics explored in this trail relate to what she is currently researching, she regularly uses this to accompany her current project. She also regularly posts on her Instagram page, @amywalker_historian, exploring a diverse variety of historic items and topics. Thank you to Amy for this wonderful addition to our Academic Practice & Digital Humanities Series!
When I first started researching my family history ten years ago, I never expected it to evolve into one of my research projects as a historian. This project developed from my curiosity of searching locations relating to my ancestors. While studying at the University of Greenwich and the Institute of Historical Research (IHR), I focused on one street in particular, ‘Queen Street, Greenwich’. Many of my family members on my maternal Grandfathers side were residents along this street, some even being born there. Unfortunately, this street and the buildings that lined it no longer exist. In the 1930s, the London County Council demolished multiple streets with problems of poverty. In their place, flats were built to accommodate the growing population. Today, there is nothing that physically exists of Queen Street, even the knowledge that it was there. With this being said, maps have been one of the most useful sources used to uncover the unknown. They have captured places, roads and buildings that have changed over time, acting as a visual record of time before now. I want to build awareness of Queen Street, recovering the forgotten history of the road itself and the people who lived there. This blog will explore seven maps that have been of great use across my research. I will be evaluating the importance of using maps in a variety of different ways and express how I will develop my own maps from my discoveries. Some of the map that will be explored include a collection of maps from the Ordnance Survey Series and Charles Booth’s Poverty Map. Useful websites and links will also be included, demonstrating the accessibility to a wide variety of maps open to the public.
Queen Street
Queen Street has had very little recognition from other historians, making my research slightly difficult to compile but unique at the same time. Not many sources exist that support this topic, I have had to use my own skills to develop new discoveries throughout this research journey. I began to involved Queen Street into many of my MA assignments at the IHR, using maps in most of them.
When it came to using maps in my research, availability and what was being shown in the map was an important consideration. Some maps did not focus on the Greenwich area, others did not show street names and buildings in great detail. These were of less use to me when trying to locate the demolished street. Layers of London (https://www.layersoflondon.org), a historic maps website developed by the IHR, provided a variety of records for me to search as well as Digimap (https://digimap.edina.ac.uk), a subscription-based website of historical maps for higher and further educational institutions. The National Library of Scotland also hold a large number of high-resolution, zoomable maps that can accessed via their website (https://maps.nls.uk). Most of the maps shown in this blog came from this site in particular, their wide variety of pictures allowed me to explore the changes in Greenwich throughout several decades.
C. and J. Greenwood’s 1828 Map and Joseph Cross’s 1833 Map
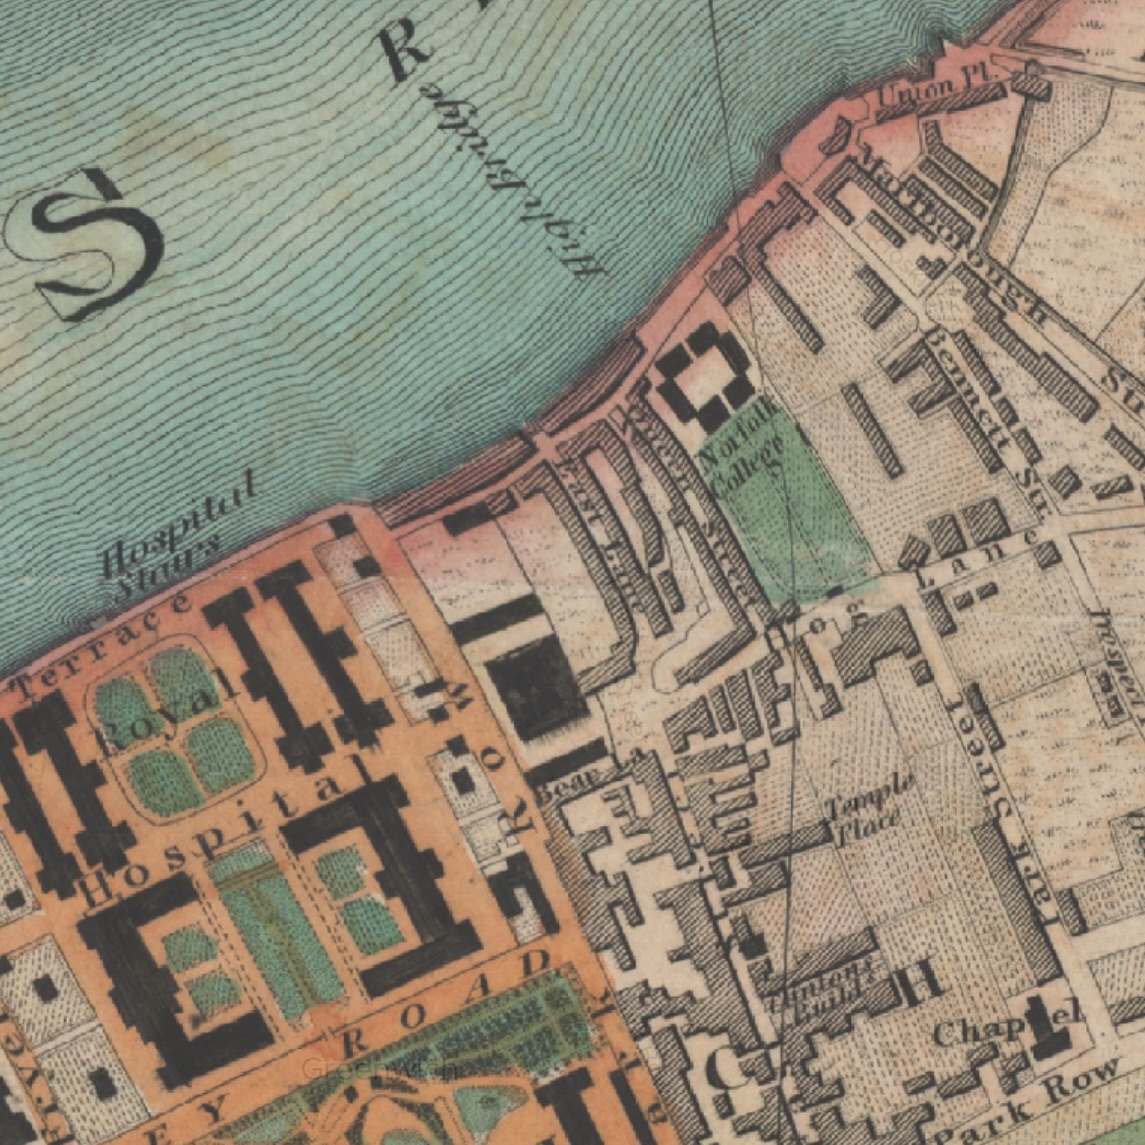
C. and J. Greenwood’s 1828 Map https://www.layersoflondon.org/map/overlays/greenwood-1828 Map from Layers of London. Queen Street can be found to the left of Norfolk College.
C. and J. Greenwood’s 1828 map and Joseph Cross’s 1833 map are two of the oldest maps used in this project. There are, of course, many maps of Greenwich that date back further but Greenwood’s and Cross’s maps are the earliest examples that label the words ‘Queen Street’ on the location of the demolished road.
Greenwood’s map was made to depict the growth of London by using Horwood’s 1799 map as a comparison. Th 1828 map is highly detailed for its age, most during this period only tend to focus on main roads and famous landmarks. Not many went to the extent of adding details of ordinary homes and street names.
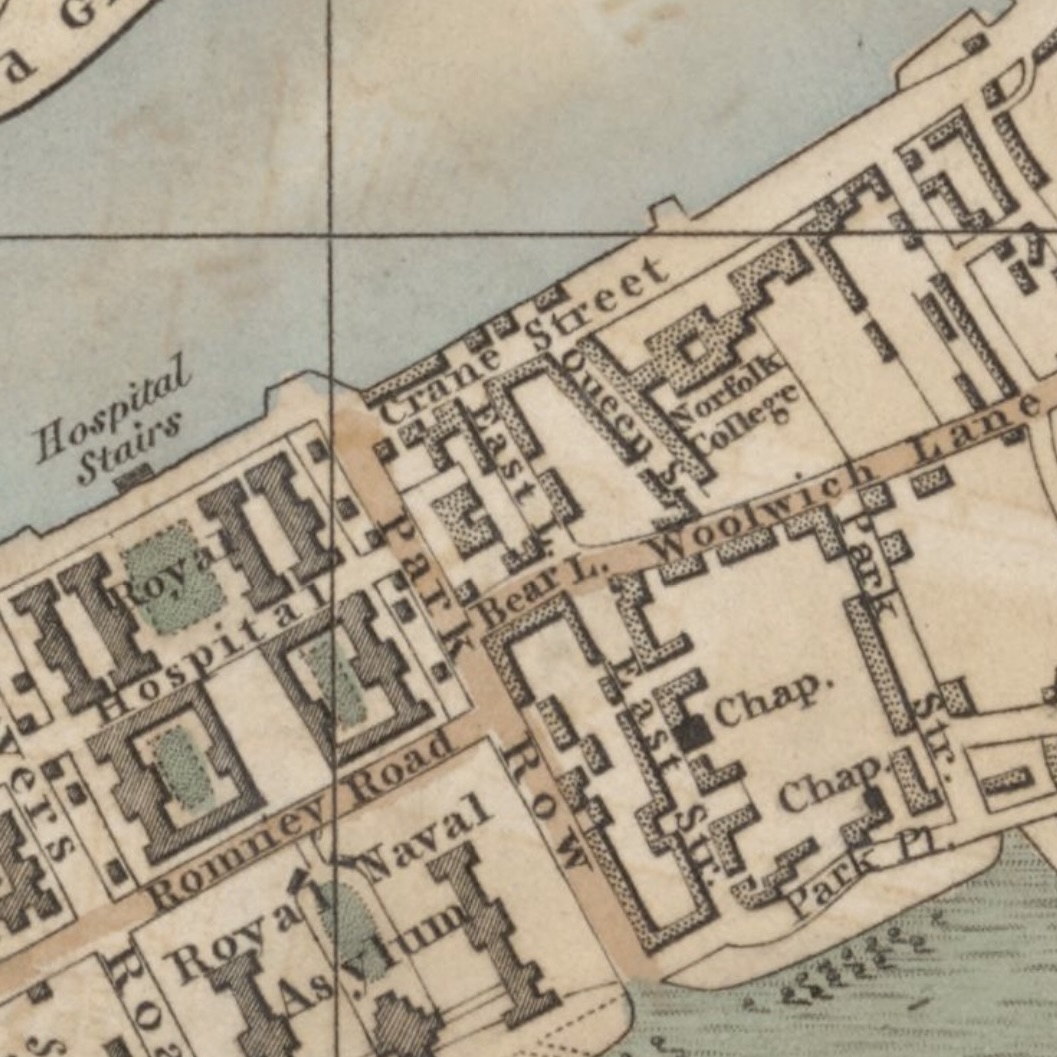
Joseph Cross’s 1833 Map https://maps.nls.uk/view/262720137 Map from National Library of Scotland. Queen Street can be found to the left of Norfolk College, just below Crane Street.
Joseph Cross’s 1833 map was an updated version of his 1828 map of London. Like Greenwood, Cross published a highly detailed map to express the masses of developments made across London. The 1833 version is much more defined than his previous edition, reason why I’ve chosen to focus on the 1833 one specifically.
When it comes to my research, these maps were the first to show me where Queen Street was originally located. Bringing attention to the date on these maps, they have also helped me consider how old the street was. Before using maps, censuses were my main source for researching the street, taking me back to as far as 1841. Greenwood’s map took me back further, proving the road was much older than censuses could show me. As mentioned already, there are older maps of Greenwich that include the shape of the road but does not have the street labelled with its name. This creates a problem with wanting to find the age of the road. Working with the information available, the age can only be estimated at this point.
Ordnance Survey Maps, 1895 and 1916
The Ordnance Survey is the national mapping agency of Great Britain. It is their job to construct and maintain detailed maps of England, Wales and Scotland.
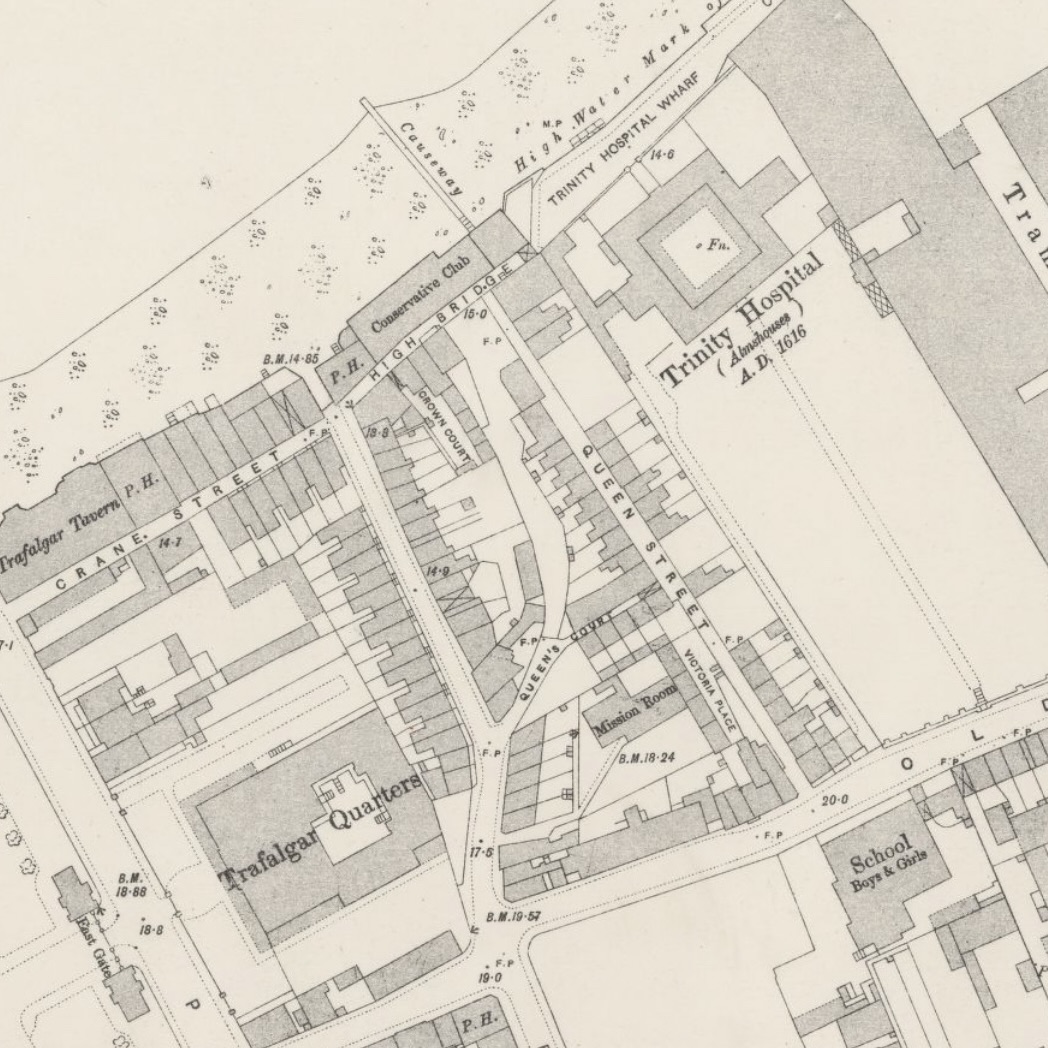
Ordnance Survey, 1895 https://maps.nls.uk/view/101202489
Map from National Library of Scotland. Queen Street can be found to the left Trinity Hospital.

Ordnance Survey, 1816 https://maps.nls.uk/view/103313432
Map from National Library of Scotland. Queen Street can be found to the left Trinity Hospital.Ordnance Survey maps provide the most detailed depiction of Queen Street. The sizing and proportions of the street are more carefully consider, making them very reliable in evaluating where the street was actually positioned. Buildings are also individually shown, displaying each sperate house rather than drawing them as shaded clusters. This allowed me to work out the door numbers of each house, with the additional help from censuses. This gave me to precise information of who lived in each house and how many lived in a single building. Many of my ancestors were residents of the street during this time period, reason why I was particularly interested in these maps. Finding the precise location of where they lived was my main curiosity before starting this project, now I am interested to take this further and investigate their neighbours.
The two maps offered a comparison of urban development across the twenty-one-year gap, allowing me to evaluate the differences and changes that occurred over time. I have also used these maps as a transparent layer on top of a current day map. Allmap Editor (https://editor.allmaps.org) has been the best site to experiment this with this. Using maps from the National Library of Scotland and warping them to fit a modern-day map has allowed me to develop a visual representation of where the street stood and the chance to observe what has changed and what has remained the same over the past 100 years.
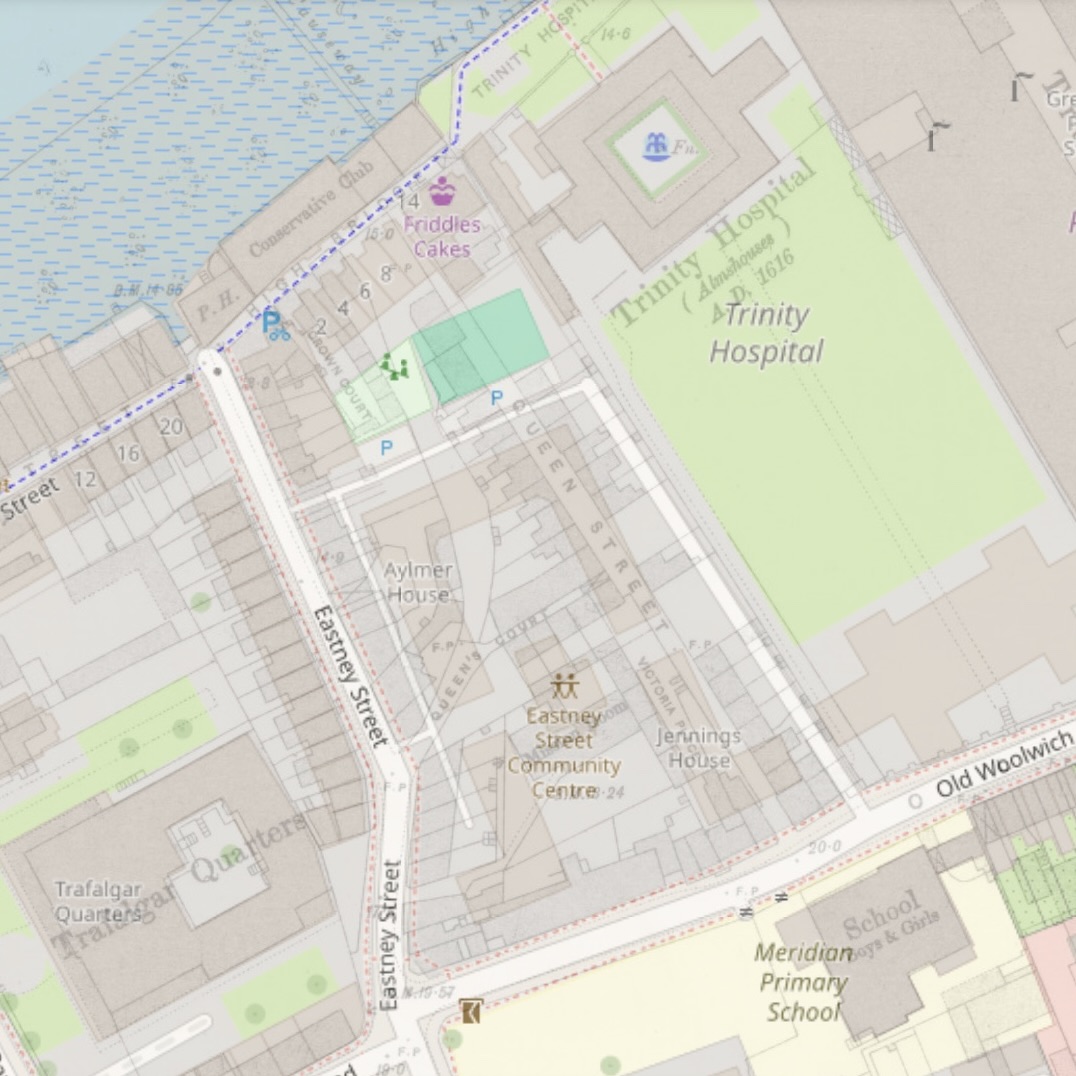
Allmap Editor Georeferenced Map (‘Ordnance Survey, 1895’ used as historic layer)
The flats that stand there today can be seen in the spot where Queen Street ran.
Charles Booth’s Poverty Map
Charles Booth’s Poverty Map is most certainly one of my favourite maps to work with. Booth’s social survey covers the last decade of the nineteenth century, offering a different view to mapping the city and its surrounding boroughs. This map is very different than others. Rather than focusing on geographical features, Booth chose to observe the people who lived along the streets of London. Having explored many maps, I have found this topic is very rarely found in others. His colour code method created a clear assessment of the different social classes across London. Blue, for example, represents those who were poor. I chose to use this as my example because this was the colour of Queen Street.
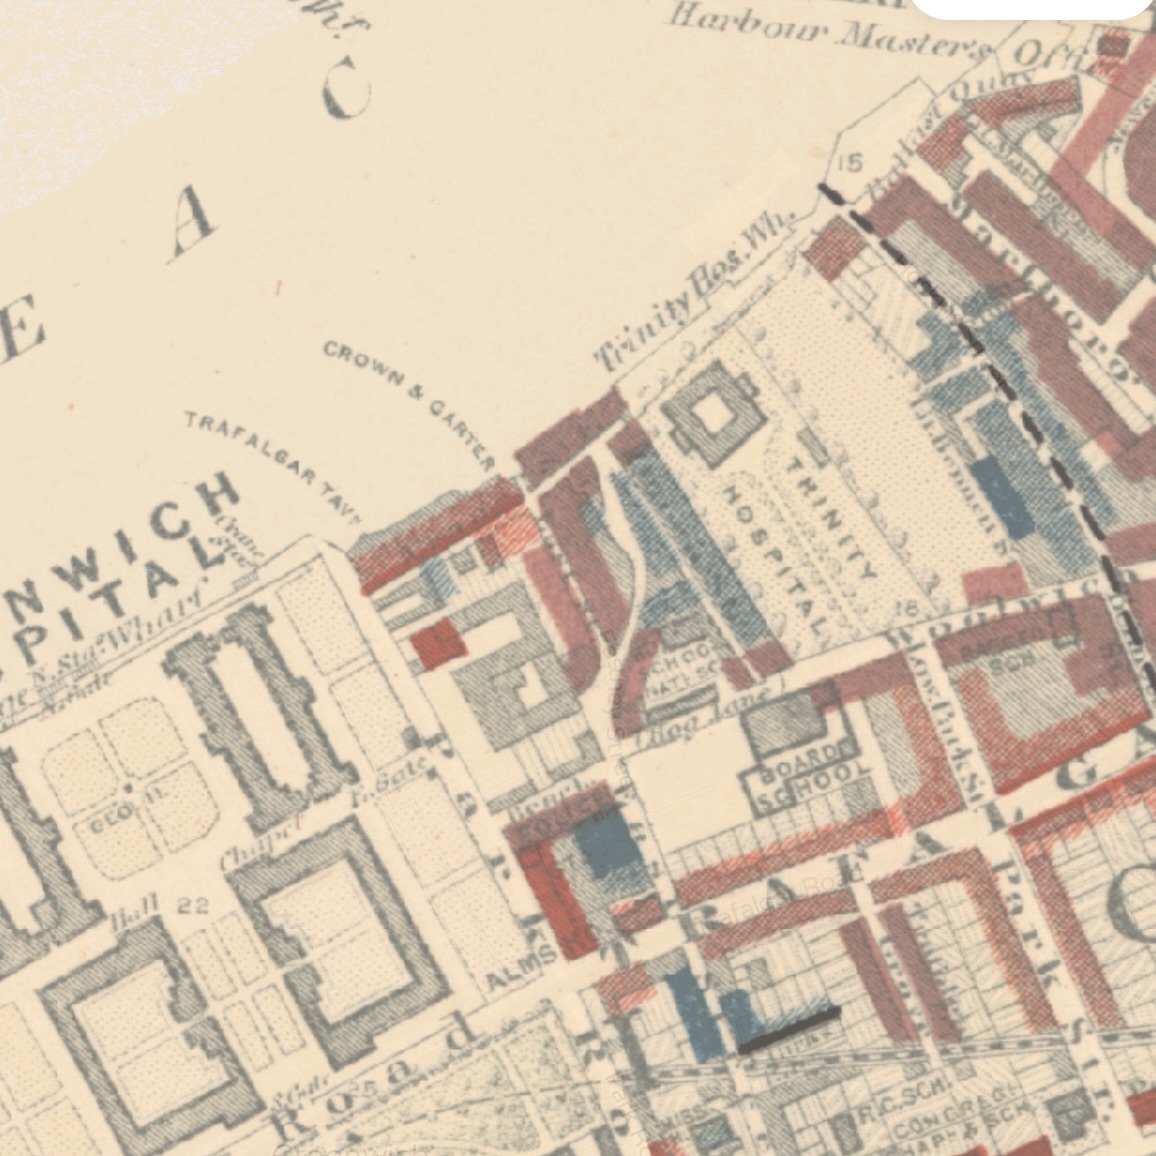
Charles Booth’s Poverty Map https://www.layersoflondon.org/map/overlays/charles-booth-s-poverty-map-1886-1903
Map from Layers of London. Queen Street can be found highlighted blue, to the left of Trinity Hospital.
The colour code provided me with information on the social class of those who lived along Queen Street. This allowed me to consider the everyday lives of these people, forming a better understanding of information provided on the censuses, such as their occupation. Most residents were labourers and some housed 15 people to one building.
Notes made by Booth as part of his survey accompanied the map in describing the street. Printed in a modern edition of his notes, Queen Street was described as “Old houses, 2-st plus attic. Narrow paved street. Rough dock and riverside labourers. “Wives go out washing and men loaf about, doing an odd day now and then.” North end is better than south.” (Booth et al., 1996). Not only does this description correspond with his poverty map and private more detail on the people that live there, the 1895 and 1916 maps also showed the road was rather narrow.
Bacon’s Large-Scale Atlas of London and Suburbs, 1927 and Ordnance Survey Map, 1938
During the 1930s, London poverty slums began being destroyed. I am still yet to discover the exact year Queen Street was demolished. Despite this, I have encountered maps that gave me suggestions of when the demolition could have taken place.

Sheet 18 from Bacon’s large scale atlas of London https://www.antiquemapsandprints.com/products/greenwich-blackheath-deptford-lewisham-new-cross-rotherhithe-bacon-1934-map-p-7-014377 Map from Antique Maps & Prints. Queen Street is shown as Howe Street in this map, to the left of Trinity Hospital.
Map from National Library of Scotland. Queen Street had be demolished at this point. The new flats stand in its place, in the shape of an upside down ‘U’.
During this period, Queen Street was no longer called “Queen Street”. George Bacon’s 1934 map shows the street was then named “Howe Street”. Being made aware of this may help in discovering new sources, being aware not to search for Queen Street in this decade. The date of the map also revealed the road was still standing at this point, showing demolition took place on Queen Street/Howe Street in the latter half of the 1930s. The Ordnance Survey Map from 1938, on the other hand, reveals the street is gone by this point. Using both of these maps has helped me narrow down when the road was actually demolished but the exact date is something I am still working on.
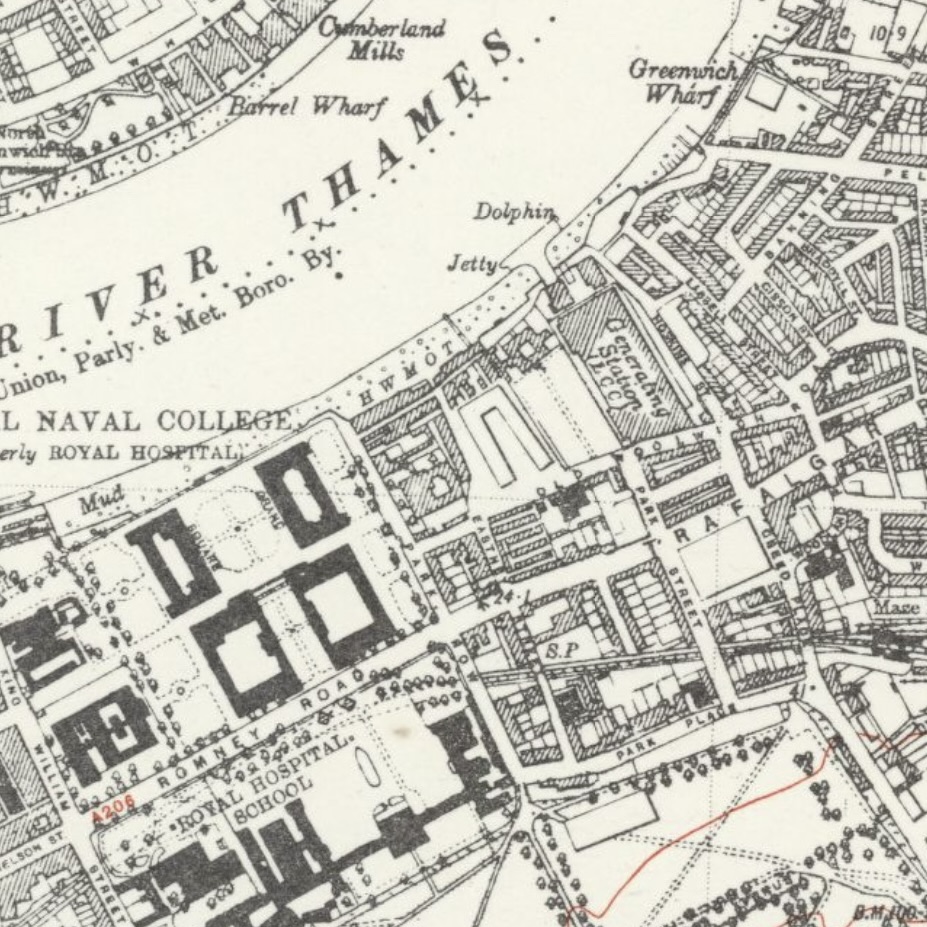
Ordnance Survey, 1838 https://maps.nls.uk/view/102345888 Map from National Library of Scotland.
Focusing on a wider perspective of Greenwich and Deptford, I have found several locations that were demolished during this period by the London County Council. The new buildings that stand in their place all follow the same style – the same colour bricks are consistently used as well as the font used to write the name tiled to the flat. It is my plan to create my own map in the near feature, showing the locations of the many streets that were destroyed. Other streets found so far are very similar to Queen Street, they were highlighted blue in Charles Booth’s poverty map and nothing remains in their location to show they were even there.
This blog has demonstrated the variety of ways maps have been used as part of my research. The value they hold in piecing together the mystery of Queen Street, working out any bit of information about the unknown street. However, this is not the end of using maps in this project. Even while writing this blog, I was coming across maps I had never encountered. My examples have shown how maps can be used in a number of distinctive ways; understanding time frames, differences and changes to structures, and consideration of social classes and the people along the street. I never realised what a key role they would play in this project, they shape and form the base of my research. If I had never referred to a map to begin with, I would have never found where Queen Street was.


